DSCview for Windows
|
|
|
|
|
|
|
A Linux version is also available.
DAPtools Basic Package includes... |
|---|
DSCview, like DAPlog, works with DAPcell server-side disk-logging to deliver a ready-to-run application that logs acquired data to disk continuously at extreme speeds. This easily installed application requires no programming of any kind, and scales directly with each added PC.
DSCview, a complete Windows application, allows immediate and easy access to the iDSC 1816. DSCview requires no programming, and provides a graphical interface to
- save and load workspaces
- select system options
- design and configure filters
- perform signal conditioning
- configure multiple iDSC boards
- output data in a graph and table
- disk log data to a text or binary file
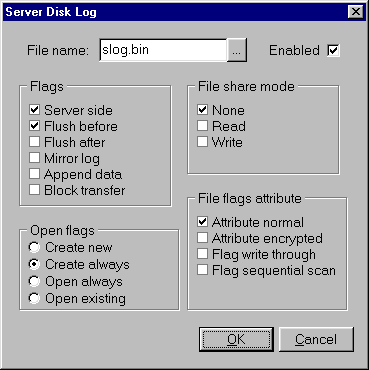
- server disk log data to a binary file by the server
Microstar Laboratories includes appropriate software from DSCview in its support for other interfaces that, like DSCview, require no programming -- DASYLab and LabVIEW -- as well as for LabWindows/CVI and MATLAB. We also include the same user functionality for Visual Basic, Visual C++, and other Windows programming environments through the DSCIO.DLL. The DSCIO.DLL provides a link between these programming environments and the iDSC board. It lets users easily program custom interfaces in any environment they choose. If you prefer, use the Delphi and C++Builder development environments through a native DSC Component, and program your own user interfaces. All user interfaces share a common look and feel to designing and configuring filters.
iDSC Filters
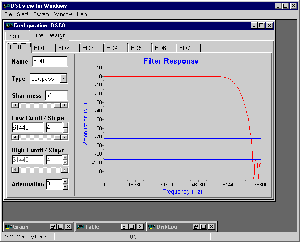
iDSC filters are activated through the Configuration Window, which has a Filter Design tab to display the Filter Design Screen and an Input tab to display the Input Screen.
Filter Design Screen
When the Filter Design tab is selected, it activates the Filter Design Screen. There are eight tabs that the user can name to identify up to eight different filter designs: a different filter design for each channel, if required. Selecting a tab puts that screen on top in the window. The user can enter the following parameters:
- Filter Name - a unique name for each filter design
- Filter Type - the filter type, lowpass or bandpass
- Sharpness - the number of taps in the final filter stage, an odd number in the range 37 to 255 (range dependent on sample rate) that determines the sharpness of the corner frequency response
- Low Cutoff Frequency - the first transition band, expressed in Hertz, in the range 2% to 80% of the Nyquist frequency
- Low Cutoff Slope - the width of the first transition band, expressed as a % of the Nyquist frequency, in the range 0 to 80
- High Cutoff Frequency - the second transition band, expressed in Hertz, in the range 2% to 80% of the Nyquist frequency
- High Cutoff Slope - the width of the second transition band, expressed as a % of the Nyquist frequency, in the range 0 to 80
- Attenuation - the response in the stop band, expressed as a value, in the range 6.0 to 12.0
In addition, the user can access these additional parameters through the right mouse button:
- Crosshair Track - tracks the filter response curve to determine the exact cutoff frequency, cutoff slope, or attenuation at a particular point
- Y Display - displays the filter's amplitude response in linear, linear zoom, log, log zoom, or unit step form
- Defaults Load - loads the default filter response graphs for a particular sample rate
- Copy - copies the filter design parameters from the filter design to the clipboard
- Paste - pastes the copied filter design parameters from the clipboard to another filter design
Input Screen
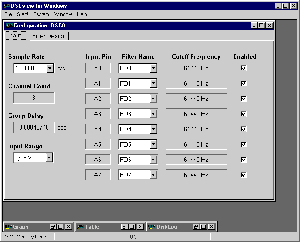
When the Input tab is selected, it activates the Input Screen, where the user can enter the following parameters:
- Sample Rate - the sample rate, ranging from 8 samples per second per channel to 153,600 samples per second per channel
- Input Range - the input range, +/- 5 V or +/- 10 V
- Filter Name - maps an input pin to a named filter design
- Enabled - enables or disables each input pin
In addition, the user can view the following read only properties:
- Channel Count - the number of enabled input pins
- Group Delay - the amount of time it takes for a reading to pass through the digital filters, expressed in units of seconds
- Input Pin - eight input pins, A0 through A7
- Cutoff Frequency - the first and second (if exists) transition band, expressed in Hertz
Signal Conditioning
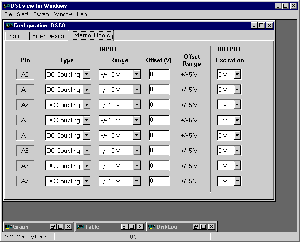
Signal conditioning is activated through the External Board tab, which is hidden by default and must be explicitly enabled.
External Board Screen
To enable the External Board tab, first select System|Board Setup Display from the DSCview menu to activate multiple iDSC boards support. After selecting the iDSC board of interest, use the right mouse button to select External Board Enable. The user can enter the following parameters:
- Input Type - the type of input signal, DC coupling, AC coupling or Excitation
- Input Range - the input range, +/- 10 mV, +/- 20 mV, +/- 50 mV, +/- 100 mV, +/- 200 mV, +/- 500 mV, +/- 1 V, +/- 2 V, +/- 5 V, or +/- 10 V
- Input Offset - the input offset, a voltage in the range of the Input Offset Range
- Output Excitation - the output excitation, 0 V, 1 V, 2 V, 5 V, or 10 V
In addition, the user can view the following read only properties:
- Input Pin - eight input pins, A0 through A7
- Input Offset Range - the input offset range, +/- 0.5 V, +/- 1.0 V, +/- 2.5 V, or +/- 5.0 V (supported range dependent on input range)
Multiple iDSC Boards
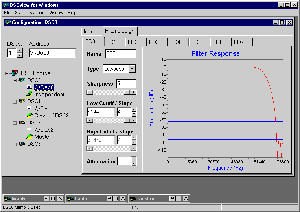
Support for multiple iDSC boards is activated through the Group Interface, selected through the DSCview menu, System|Board Setup Display.
Group Interface
The user can enter the following parameters:
- DSCs - the number of iDSC boards in the system
- Address - the unique iDSC address
- Mode - the mode of the iDSC board: Independent, Slave of Xxx (where Xxx is the name of the iDSC board) or Master (automatically set when the slaves are selected)
In addition, the user can access these additional parameters through the right mouse button:
- External Board Calibrate - calibrates the external board if the external board is enabled
- External Board Enable - enables the external board
- Raw Data - selects raw data rather than filtered data from the iDSC
- Remote Master - configures a Master iDSC board as a remote master
- Server Disk Log - configures the server disk log parameters which includes the filename, flags, file share mode, open flags, and file flags attributes
- Copy - copies the entire iDSC configuration from the iDSC to the clipboard
- Paste - pastes the copied iDSC configuration from the clipboard to another iDSC
Output Data Screens
There are four types of output data screens: graph, table, disk log, and server disk log. The user may have any number of graph, table and disk log screens. However, there is only one server disk log screen and it emerges automatically if server disk logging is enabled.
 |
 |
 |
 |
| Graph Screen | Table Screen | Disk Log Screen | Server Disk Log Screen |
Try DSCview, included in DAPtools Basic. The DSCview Demo provides a demonstration version of the filter design software included with every iDSC 1816 board. The demonstration version allows experimentation with the filter design capabilities and shows the display options.
For software for DAP boards, see DAPlog Plus Software for Windows and DAP Measurement Studio (DAPstudio).
