Multi-Channel Filtering
Introduction

It is often beneficial — and sometimes necessary — to apply filtering to signal data so that the data arrive as clean as possible prior to analysis. For xDAP systems, typically there are multiple signal channels of a similar nature, sampled at relatively high rates; for example, signals produced by a grid of microphones, or by accelerometer devices measuring multiple axes of motion. The time-honored way to do frequency selective filtering is with electronic devices before the signals are digitized. Precise and specialized instruments are available for this purpose, using hybrid analog and digital processing techniques for excellent performance. Did anybody say that the equipment is free? You should not be shocked to pay $400 or more per channel. Try to compromise on that, and problems with signal noise and distortion are likely.
In many cases, it is not only less expensive but also beneficial to filter the data after it has been digitized. The xDAP system has expanded the possibilities for this kind of digital filtering, by providing hardware that can capture 8 or 16 differential input channels at a high rate, with enough processing power to apply some serious number crunching. The FIRFILTER command provides an easy way for non-specialists to implement their own customized digital filtering, using the filter designer of DAPstudio software. As filter properties are adjusted, the effects can be evaluated immediately with live signal data. The application interface has been preserved across multiple hardware and software generations, while the implementation has advanced with each generation.
Here's is an example applying the FIRFILTER processing in the traditional way.
  // Define pipes to transfer intermediate filter results
  PIPES pCleaned0 WORD, pCleaned1 WORD, pCleaned2 WORD, pCleaned3 WORD
  PIPES pCleaned4 WORD, pCleaned5 WORD, pCleaned6 WORD, pCleaned7 WORD
  ...

  // Perform filtering calculations on each signal
  FIRFILTER(IPipe0, FilterVec,0, 1,1,-1, pCleaned0)
  FIRFILTER(IPipe1, FilterVec,0, 1,1,-1, pCleaned1)
  FIRFILTER(IPipe2, FilterVec,0, 1,1,-1, pCleaned2)
  FIRFILTER(IPipe3, FilterVec,0, 1,1,-1, pCleaned3)
  FIRFILTER(IPipe4, FilterVec,0, 1,1,-1, pCleaned4)
  FIRFILTER(IPipe5, FilterVec,0, 1,1,-1, pCleaned5)
  FIRFILTER(IPipe6, FilterVec,0, 1,1,-1, pCleaned6)
  FIRFILTER(IPipe7, FilterVec,0, 1,1,-1, pCleaned7)

  // Combine the filtered data streams for transfer to host
  MERGE( pCleaned0, pCleaned1, pCleaned2, pCleaned3 \
         pCleaned4, pCleaned5, pCleaned6, pCleaned7, $BinOut)
While technically correct, this solution is rather bulky.
The FIRFILTER command now has been upgraded so that you can route groups of multiplexed data channels into a single FIRFILTER processing command, and apply similar filtering to multiple channels in parallel. Here is the same thing as the configuration above, using the new multi-channel option of the FIRFILTER command.
FIRFILTER(IPipes(0..7),8, FilterVec,0, 1,1,-1, $BinOut)
This goes beyond simplicity, clarity and convenience — it is also approximately doubles the processing efficiency.
Butterworth Filtering Applications
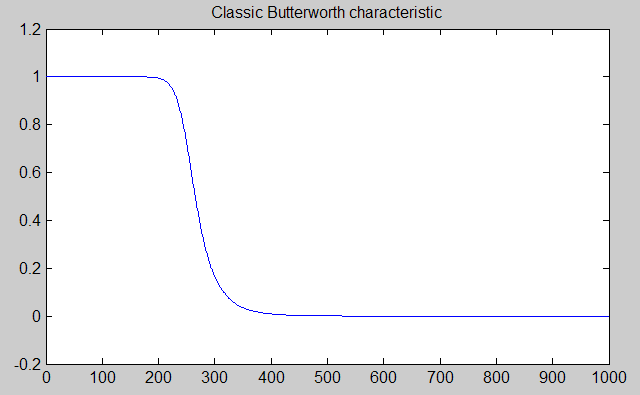
Application requirements often specify using the classic Butterworth Filter. It is easy to see why. The filter amplitude response characteristic is very appealing, with a very flat passband at low frequencies, and with a smooth rolloff into its stopband. How could it be much better?
Well, in several ways as it turns out.
- The response that starts flat at very low frequencies does not stay flat, and gradually sags as it gets closer to the cutoff frequency.
- The transition zone between passband and stopband is relatively wide.
- The phase response is nonlinear — different frequencies are shifted different amounts — which results in waveform shapes that are distorted in addition to being attenuated.
These hazards are very real, but not particularly bad, so a Butterworth characteristic is often deemed a reasonable compromise. Unfortunately, some system specifications will go beyond that, and require using a Butterworth filter. You could do better — but that isn't allowed. Better performance doesn't meet spec!
Applications that specify Butterworth filtering are almost always concerned only about the magnitude of the frequency responses (i.e., power spectral density). For the expected case that the filtering is not required to match the Butterworth phase distortions, the filtering can be done digitally to obtain the same amplitude response but with exactly zero phase distortion. The rest of this article will show how.
Butterworth Frequency Response, FIRFILTER Implementation
A FIRFILTER response characteristic is defined by an array of filter coefficients that are convolved with the signal data — basically a sequence of multiply-and-add arithmetic operations. The magic lies in the choice of the coefficients. Go to a table of coefficients that you can use.
Select the vector that defines filtering with an appropriate rolloff frequency and filter order. Copy this from the table entry and paste into your DAPL configuration script in the declarations section. (If you are using DAPstudio software, be sure to remove any "line return" characters from the end of each line as displayed in the table.) Now, add the FIRFILTER processing command into the PDEFINE section of your configuration, specifying the source data, the number of channels, the name of the filter vector to apply, and the pipe to receive the filtered data streams. Here is an example of the FIRFILTER commands that uses an 8th order filter with a half-power corner frequency at 10% of the Nyquist frequency of the digital sampling, applied to 6 channels.
FIRFILTER( IPipes(0..5),6, bw_ord8cut10, 0,1,-1, pFilteredData )
Can it really be that easy? Yes it can be, and it is.
Strictly speaking, a Butterworth filter is a recursive, "infinite impulse response" filter, while a FIRFILTER is a "finite impulse response" filter (as its name suggests). That means these filter designs are a truncated approximation, not a perfect infinite match for a true Butterworth filter. How close is the approximation? Taking one of the filter designs arbitrarily, here is a frequency response plot showing the magnitude response of the FIRFILTER in blue, superimposed on the true Butterworth characteristic in red.
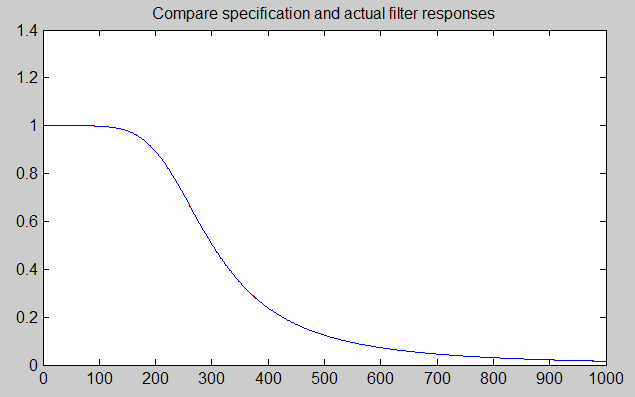
Where did the red curve go? Actually, it hasn't gone anywhere. The approximation happens to almost hide the mathematically ideal response curve. If you look very closely, you will find a few places where there is enough of a difference for the "ideal red curve" to barely peek out from behind. There is no way that analog filter component tolerances can achieve this degree of filtering accuracy.
Return to the DSP page.