Sampling Techniques Extend Demodulation Bandwidth
Modulation in Sensor Applications

View more Software Techniques.
It is not unusual for advanced sensor applications to use modulated signals. Sound, light, or electromagnetic signals can be modulated by a high frequency selected according to physical properties to be measured. For example, an infrared laser beam could be modulated by a high frequency and passed through a material. Attenuation and phase shift of the modulated signal will reveal information about the material thickness and density.
To get good resolution in measurements, it is often necessary to use high modulation frequencies. This presents a problem when the bandwidths required for the signal exceed the capabilities of the data acquisition equipment. The obvious solutions can become quite expensive.
Overcoming Sampler Limitations
|
Product Information |
|---|
Related Article |
With Data Acquisition Processors, bandlimiting effects result from lags and time delays inherent in the hardware. Presented in the order of greatest to least effect:
- Input amplifiers. The amplifiers must be able to track the signal accurately. The greatest delay is for large signal slewing. Lags for charging line capacitance can also be significant.
- Analog-to-Digital converter. A fixed time interval is required to complete an accurate conversion. This limits conversion rates.
- Multiplexer switches. A settling time is necessary to equalize any charge injection after multiplexing to a signal source.
Addressing these device limitations allows operation at maximum bandwidth.
- Minimize lags from line charging. Use good, low impedance amplifiers at the sensor to drive well-terminated signal lines.
- Avoid slewing. Slewing results when the instrumentation amplifier output is unable to track very rapid changes. It follows that if large rapid changes are avoided, the amplifier can stay within its limits but track higher frequencies. Avoid multiplexing, and measure a reduced signal level.
- Avoid charge injection disturbances. Dedicate one hardware converter to the modulated signal line. Multiple-converter Data Acquisition Processor boards such as the DAP 5400a can support this.
- Configure a single channel group. Any multiplexing operation — even if the new logical channel only reconnects to the same physical line — will introduce a small injection charge. Avoid this by configuring a single channel group. On a DAP 5400a where signals are sampled simultaneously in groups of 8, that still leaves 7 signal channels that can be assigned for other measurements.
The result of these careful hardware signal configurations is that the bandwidth limits of the circuits are raised significantly. The signals are tracked accurately. The time aperture during which a Data Acquisition Processor does its latching and conversions is extremely regular. So only the conversion rate remains as a significant bandwidth bottleneck.
Theoretical Limitations
Besides the properties of the physical devices, there are the fundamental limitations of sampled data systems to worry about... the Nyquist Limit. Suppose the absolute maximum that a sampling device can operate is 2 million conversions per second, as is the case with the DAP 5400a operating in a 4-channel mode. For this sampling rate, the Nyquist frequency limit is 1 MHz. This is a theoretical maximum. Operating near the limit is sufficient to detect that a frequency exists, but in practice you need more samples than that to accurately reconstruct waveform information. This further restricts the frequency bandwidth over which the data acquisition can operate.
What Does the Application Really Need?
For the case of the sensor application, it is not really necessary to reconstruct the waveform. It is the persistent properties of the waves over time — the amplitude and phase modulations — that contain the desired information, not the individual sample values. So as long as samples are obtained with good accuracy, it is not necessary to measure and reproduce every single cycle to extract consistent long term information.
The Demodulation Strategy
Suppose the signal modulation has frequency W, and is represented by the complex phasor P.
Suppose this signal is multiplied term-by-term with another signal with a carefully selected modulation frequency Wm.
The result is a signal with the same phase angle but with its frequency shifted from W to the new value W-Wm. What good is that? Well, if W-Wm is made sufficiently small, the high sampling rate needed to represent the signal at its original high frequency is no longer necessary. No information is lost by decimating the signal to a lower data rate.
Actual signals are real-valued rather than complex-valued, of course, so there are additional considerations to make this scheme fully practical. The basic idea is sound, but, so far, it doesn't address the problem that the sampling rate for accurately reproducing the original signal is too high for Data Acquisition Processor boards to support.
Sampling as Modulation
Suppose we restrict attention to certain discrete times separated by time interval T, so that
Because we now have a discrete time sequence, we can consider the z transform of this signal. The z transform of this discrete time signal is given by
For sinusoidal signals, we can restrict the transform variable s to a pure imaginary value.
Making this substitution, the z transform expression can be reduced.
We see a frequency shift here, much as we did in the basic demodulation scheme.
When this phenomenon occurs by accident, we consider it a data corruption, and we call it aliasing[1]. But in this instance, it is applied intentionally, and with great care, to achieve a useful result. In particular, there must be no component in the original signal that has the same frequency as the demodulation result.
A Practical Example
Leaving the mathematical motivation behind at this point, let us consider an example of a sensor signal modulated by a 4.05 MHz wave. Suppose that we shield or filter this signal carefully so that only this carrier signal and its modulation sidebands are present on the signal line. Now sample this frequency at 200000 samples per second. What happens?
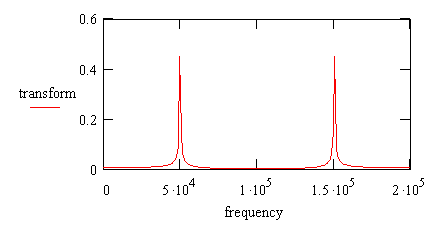
We know that the frequency 4.0 MHz will alias to frequency 0.0, because it is a multiple of the sampling frequency. Frequency 4.05 MHz is separated from a multiple of the sampling frequency by 0.05 MHz, so it will alias to the frequency 0.05 MHz, or 50 kHz. Thus, the original 4.05 MHz signal will appear as an artificial, aliased frequency of 50 kHz when the signal is sampled at 200000 samples per second. The beauty of this is that there is no computation at all to obtain this result. We just need to sample with precision, not lose any signal quality prior to sampling, and make sure that there is no interfering signal already present at 50 kHz to be confused with the demodulated signal.
This process can be checked empirically by constructing a sequence of samples for the 4.05 MHz data stream as it would appear if sampled accurately at a rate of 200 samples per second, by decimating the original sequence. Performing a DFT analysis of this data set shows the expected frequency peak at 50 kHz, at 1/4 of the sampling frequency.
If you are going to apply a DFT analysis, try to arrange it so that:
- the original modulation frequency and the sampling rate are both harmonics of a common fundamental frequency
- the DFT analysis operates on a data block with a length equaling one or more periods of the common fundamental frequency
If you can satisfy these conditions, the DFT analysis will align with the demodulated signal exactly for best accuracy. If you can't do these things, it is not fatal, you will get a slight attenuation in your magnitude estimate and a consistent shift in the phase estimate, but these effects can be calibrated and corrected.
How Far Can You Take This?
The principal consideration is hardware component characteristics, but the original chip manufacturers publish no specifications, make no tolerance guarantees, and most certainly do not guarantee consistent fabrication processes. Data Acquisition Processors are subject to these component variations. The only way to determine the limitations is a hardware test. Just don't push the performance limits too hard presuming that they will never change. Performance could change for the better or for the worse when chip manufacturers advance technology or economize on their manufacturing yields.
With a DAP 5400a, you might try to push the original signal rate as high as 5 or 6 MHz, which is a significant extension beyond the 1 MHz Nyquist limit of ordinary sampling. At some point, expect to see a distinct rolloff in the signal magnitude. Some signal attenuation might be acceptable if you calibrate the rolloff of input electronics and your sensor response together.
Conclusions
We often caution: If you sample while any frequencies higher than the Nyquist limit are present in your signals, your data will be corrupted [1]. That is still good everyday advice, but it assumes that the signals are the low frequency bands and that the high frequency bands are the noise. Though the same principles apply, the situation is turned on its head for this particular case: a frequency well beyond the Nyquist limit is the signal. Any actual low frequencies show up as corruptions of the measurement.
Knowing where aliasing will occur and planning for it, the sampling process can provide a "for free" demodulation, to accurately recover phase and magnitude information about signals that you would ordinarily not be able to measure with your Data Acquisition Processor. The hardware slewing, settling, and conversion intervals account for most of the time limitations on sampling. Given strong signal conditioning and dedicated hardware signal lines, the input amplifiers of Data Acquisition Processors can track unusually high frequencies quite well, so samples are accurate, just recorded at a low rate. This produces the intended demodulation.
This technique is for specialists, not for everybody. You know who you are. If you have just the right application, this technique is worth a try.
Footnotes and References:
- See for example Analog and Digital Filtering for Anti-Aliasing, a note on this site.
Return to the Software Techniques page.