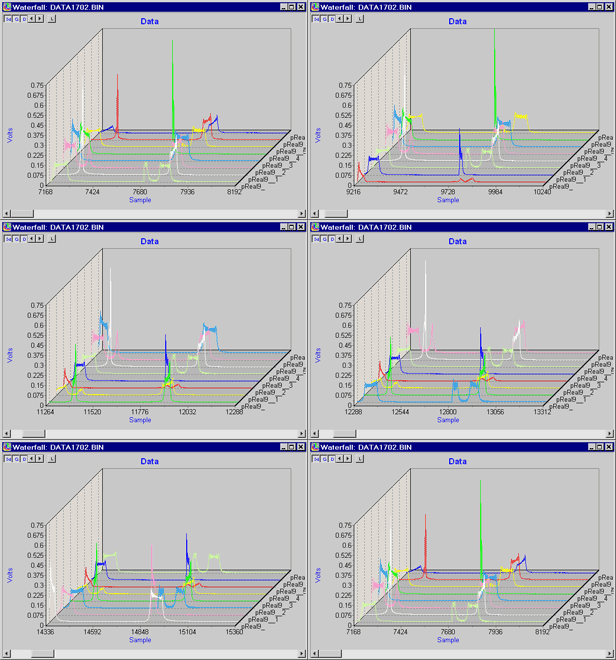
Use the Waterfall window to display a time history of blocked data – to look at very large amounts of data quickly, looking for trends and behaviors. This allows you to look at spectra over frequency and over time simultaneously.
Waterfall line graphs provide a useful way to detect consistent patterns or local disturbances in FFTs or other large sets of data where you need an overview of large amounts of data quickly. Optional rotating colors for the waveforms allow a specific event to move back in time with the same color.
Customize the display for your requirements. Configurable options include the visual (3D display, waterfall depth, background color, titles, captions, channel colors) and the practical (history length, units of measurement, types of measurement).