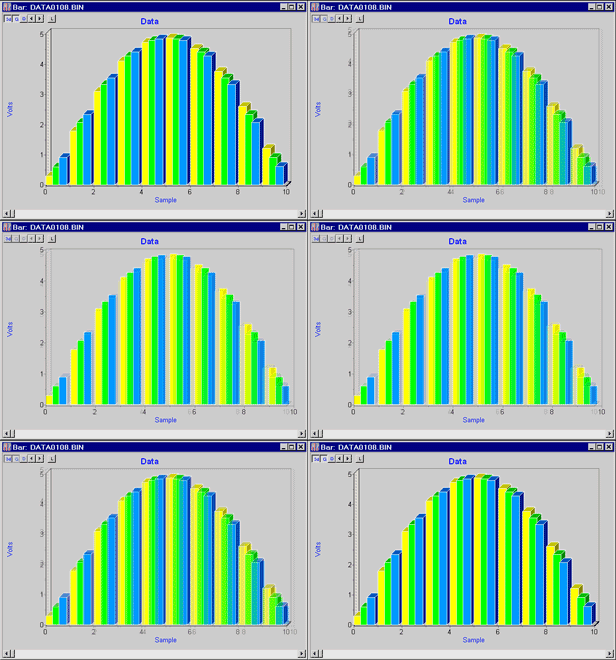
The Bar window displays graphical representations of data acquired and processed by the DAP board. The vertical bars provide an additional way to look at the data other than in the line graph format of the Graph window. You may prefer a bar graph to a line graph if the graph displays lower resolution spectra.
Customize the display for your requirements. Configurable options include the visual (3D display, background color, titles, captions, channel colors, border colors) and the practical (history length, units of measurement, types of measurement).